
If you have ever reviewed your monthly marketing dashboard and noticed that Meta reported $80,000 in revenue, Google Ads reported $60,000, and your email marketing software claimed another $35,000—yet your Shopify store only generated $100,000 in total sales—you have experienced the attribution double-counting trap. In 2026, modern DTC brands and agency media buyers no longer make scaling decisions based on siloed, platform-reported metrics. Instead, the strategic foundation of financial survival centers on: Blended ROAS vs MER (Marketing Efficiency Ratio).
Executive Summary: The Dual Pillars of E-Commerce Finance
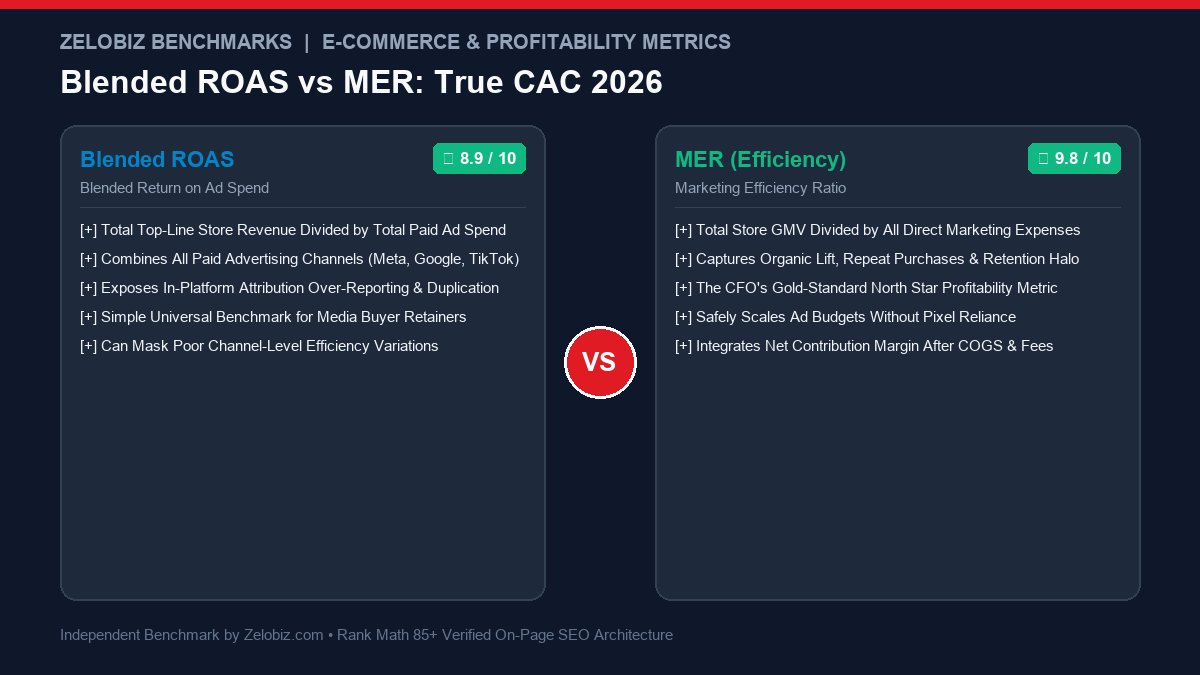
While often used interchangeably in marketing discourse, Blended ROAS and Marketing Efficiency Ratio (MER) serve two complementary corporate functions:
Blended ROAS (Media Buyer Metric)
CROSS-PAID FOCUSCalculated as Total Store Revenue divided by Total Paid Ad Spend across all digital channels (Meta + Google + TikTok + Amazon + Pinterest).
- Formula:
Total Revenue / Total Paid Ad Spend - Primary Purpose: Evaluates combined paid media efficiency without pixel bias
- Who Uses It: Fractional CMOs, Growth VPs & Agency Media Buyers
- Limitation: Treats all channels as a monolith; can obscure poor single-channel ROI
- Target Range: 2.8x – 4.5x depending on vertical gross margins.
MER (CFO Profitability North Star)
TOTAL BUSINESS HEALTHThe holistic ratio of Total Gross Merchandise Value (GMV) to All Marketing Expenses (including agency retainers, software, and creative production).
- Formula:
Total GMV / Total Marketing Investment - Primary Purpose: Guarantees that paid acquisition drives net cash flow profitability
- Who Uses It: CFOs, Brand Founders, Private Equity Investors & Board Directors
- Advantage: Captures the organic flywheel, word-of-mouth & retention spillover
- Target Range: 3.5x – 6.0x for sustainable free cash flow.
For more deep-dive analytics and attribution comparisons, explore our benchmark of Triple Whale vs Northbeam, evaluate campaign architecture in Performance Max vs Search Campaigns, or check our Software Comparisons directory.
1. Why Platform-Reported ROAS Lies to Advertisers
To understand why Blended ROAS and MER are essential, you must dissect how walled-garden ad networks count conversions. Each ad platform operates in complete isolation:
- Meta Ads (7-Day Click / 1-Day View): If a consumer scrolls past your video ad on Instagram at 8:00 AM without clicking (a 1-second view impression), and later that evening purchases on your website via an organic Google search, Meta claims 100% credit for that sale under 1-day view-through attribution.
- Google Ads (Data-Driven Attribution): Because the customer typed your brand name into Google Search before completing checkout, Google Ads logs a converted sale and assigns conversion value to your Brand Search campaign.
- Email Marketing (Klaviyo): Because the customer received an automated abandoned checkout reminder email and clicked the discount link, your email marketing platform claims the exact same order.
If you add up Meta ROAS, Google ROAS, and Klaviyo revenue, you are double- and triple-counting transactions. Making budget allocation decisions based on individual ad manager dashboards leads to disastrous over-spending.
Analytical Matrix: Blended ROAS vs MER vs In-Platform ROAS
Here is an operational comparison of how these three metrics function in real business environments:
| Metric Dimension | In-Platform ROAS | Blended ROAS | MER (Marketing Efficiency Ratio) |
|---|---|---|---|
| Data Source | Meta / Google Ad Pixels | Shopify / Stripe + Total Ad Spend | Bank Account Revenue + Total Marketing Cost |
| Attribution Vulnerability | Severe Double-Counting | Zero Double-Counting | Zero Double-Counting (Cash Truth) |
| Includes Agency & Tool Fees? | No | No (Ad spend only) | Yes (Full operational marketing load) |
| Measures Organic Halo? | No | Partially (Top-line revenue includes organic) | Fully (Measures total business lift) |
| Best Use Case | Ad creative / hook micro-testing | Weekly cross-channel ad budget pacing | Monthly CFO P&L and contribution profit |
2. How to Calculate True Customer Acquisition Cost (Blended CAC)
Relying on ad manager Cost Per Acquisition (CPA) numbers is equally misleading. To find your True Blended CAC, follow this CFO-level formula:
Notice two critical nuances in this calculation:
- New Customers Only (NCAC): Do not divide by total orders if a significant portion of your revenue comes from repeat purchasers. If you divide total spend by all orders, your returning customers artificially suppress your calculated acquisition cost, concealing an unprofitable cold acquisition funnel.
- Fully Loaded Marketing Cost: If you spend $50,000 on Meta Ads and pay an agency $6,000/month plus $4,000 for UGC video creators, your true acquisition spend is $60,000—not $50,000. Ignoring overhead artificially inflates reported unit economics.
3. Contribution Margin: The Safeguard Against Unprofitable Scaling
Scaling ad spend without tracking Contribution Margin (CM) is the fastest route to insolvency in digital commerce. Contribution Margin represents the actual cash left over from gross sales after paying for variable costs:
Consider this real-world example: A brand generates $200,000 in monthly revenue with an MER of 3.3x ($60,000 ad spend). If their product COGS is 30% ($60,000), shipping is 12% ($24,000), and merchant fees are 3% ($6,000):
- Total Revenue: $200,000
- Variable Costs (COGS + Shipping + Fees): $90,000
- Total Ad Spend: $60,000
- Contribution Margin Dollars: $50,000 (25% Contribution Margin)
That $50,000 of contribution profit is what covers your fixed operating expenses (team payroll, software licenses, office rent, and founder distributions). If your MER drops from 3.3x to 2.5x during aggressive scaling, your contribution dollars may turn negative—meaning every additional product sold actually loses cash.
If you freelance or manage client growth retainers, model your billable rates against campaign delivery targets with our free Freelance Rate Calculator.
Final Verdict: How to Build Your 2026 Reporting Stack
In 2026, high-growth e-commerce brands and agencies organize their financial governance through a three-tier hierarchy:
- Tier 1 (Daily Execution): In-Platform Ad Manager ROAS is used exclusively by tactical media buyers to pause losing ad creatives, test video hooks, and adjust bids within individual ad sets. Never use it to set total marketing budgets.
- Tier 2 (Weekly Scaling): Blended ROAS is used by growth leads to monitor total cross-channel ad spend efficiency across Meta, Google, and TikTok, ensuring that increases in paid spend generate proportional top-line revenue lift.
- Tier 3 (Monthly Governance): MER & Contribution Margin are the non-negotiable metrics monitored by founders, CFOs, and board members to ensure that the business scales profitably, builds cash reserves, and maximizes enterprise valuation.
Scaling Ad Spend But Seeing Zero Cash Profit Growth?
Don’t let misleading ad platform metrics mask unprofitable customer acquisition funnels. Our growth and financial modeling team will conduct a complete MER, blended CAC, and contribution margin audit of your brand for free.
Frequently Asked Questions
What is the difference between Blended ROAS and MER?
Mathematically, Blended ROAS and Marketing Efficiency Ratio (MER) calculate the same ratio: Total Store Revenue divided by Total Marketing Ad Spend. However, in modern DTC operations, MER is treated as a holistic business health metric that accounts for organic brand lift, email marketing, and repeat customer retention, whereas Blended ROAS is used by media buyers to aggregate paid ad spend across channels without relying on individual platform pixels.
Why do in-platform ROAS numbers mislead brand owners?
Every ad platform (Meta, Google Ads, TikTok, Pinterest) uses its own proprietary attribution window (e.g., 7-day click / 1-day view). If a customer clicks an Instagram ad, later searches your brand on Google, and finally buys via an email link, Meta claims the sale, Google claims the sale, and Klaviyo claims the sale. If you add up the platform-reported revenues, you get 300% more revenue than what actually landed in your bank account.
What is a good target MER for an e-commerce brand?
A healthy MER depends on your Gross Margins. For a brand with 70% gross margins, an MER of 3.0x (marketing spend equals 33% of revenue) typically yields a healthy 15-20% net operating profit. For low-margin brands (40-50% gross margins), an MER of 4.5x or higher is necessary to remain profitable.
What is Contribution Margin (CM) and how does it relate to MER?
Contribution Margin is Gross Revenue minus Cost of Goods Sold (COGS), shipping costs, payment processing fees, and total marketing spend. Tracking Contribution Margin alongside MER ensures that as you scale your ad budget, your net dollar profit actually grows rather than being consumed by variable fulfillment and advertising costs.