
An AI pivot table summary arrives fast, reads confidently, and is often describing something other than the question you asked. Asking AI to build or explain a pivot in Excel works well for the mechanical parts and badly for the interpretive ones, and both come back sounding equally certain.
A pivot table is where AI summarisation is most likely to be wrong in a way nobody notices, because it has to infer what your data means from column headings, and column headings lie constantly.
Short answer: Use AI to work out which fields belong in rows, columns and values, to explain a pivot somebody else built, and to fix layout problems. Do not rely on it to tell you what the numbers mean, because it infers meaning from column names and your column names almost certainly do not mean what they say.
Why Column Names Mislead It
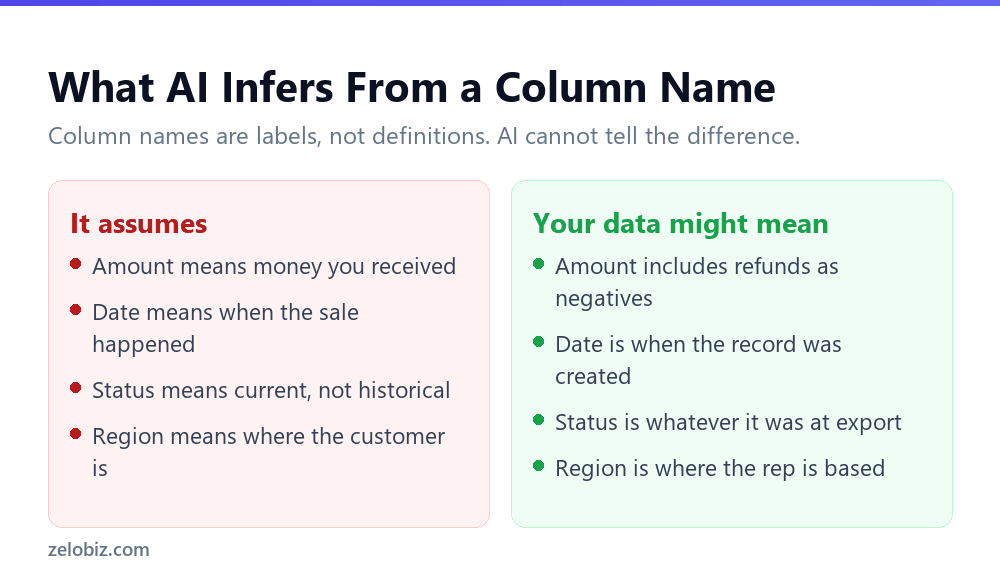
This is the root of nearly every wrong pivot summary. AI reads a column called Amount and reasonably assumes it means money received. In most real exports, Amount includes refunds as negative numbers, credits, and sometimes tax.
The summary that comes back will be arithmetically perfect and describe something other than what you asked. Total revenue that quietly nets off refunds is not total revenue, and nothing in the output flags the difference.
💡 Pro tip: Tell it what the columns mean before asking anything. One sentence per ambiguous column changes the quality of the answer more than any other single thing you can do.
The Questions It Answers Well
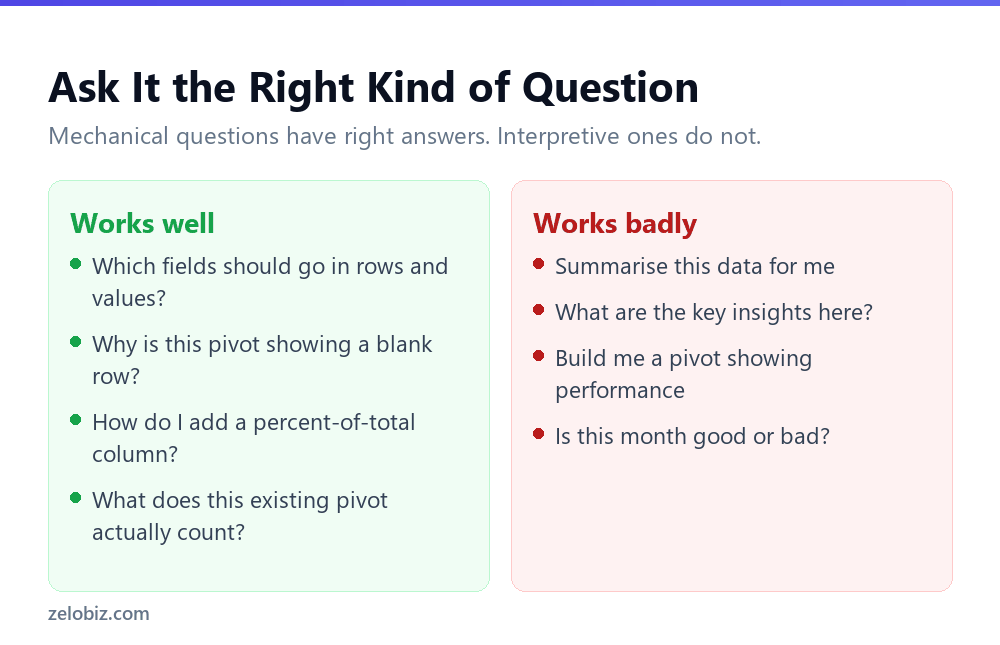
Mechanical questions have verifiable right answers, which is exactly what makes them safe to delegate.
Which fields go where
Describing what you want to see and asking which fields belong in rows, columns, values and filters is genuinely useful, particularly if you build pivots rarely. The answer is immediately checkable because you can see whether the result is what you asked for.
Explaining a pivot somebody else built
This is the strongest use. Inheriting a workbook with a pivot whose logic is opaque is common, and asking what it counts, what is filtered and where the source range is beats reverse-engineering it manually.
It is also read-only, so the risk is close to zero. You are asking for a description, not a change.
Fixing layout and calculation problems
Adding a percentage-of-total column, changing a value field from Count to Sum, grouping dates by month, removing subtotals. These are procedural and the instructions either work or visibly do not.
The Questions It Answers Badly
Anything that requires knowing what good looks like in your business.
Asked whether a month was strong, AI will produce a plausible paragraph. It has no idea what your targets were, whether a large order was a one-off, or that the dip in March was a system migration rather than a demand problem.
The output reads like analysis and is actually description with adjectives attached. That is a genuinely dangerous thing to paste into a report, because it sounds like someone looked at the numbers and thought about them.
⚠️ Watch out: Be especially careful with any summary containing words like strong, concerning, improving or underperforming. Those are judgements about context AI does not have, and they are the sentences most likely to be quoted back at you in a meeting.
Four Checks Before You Trust a Pivot Summary
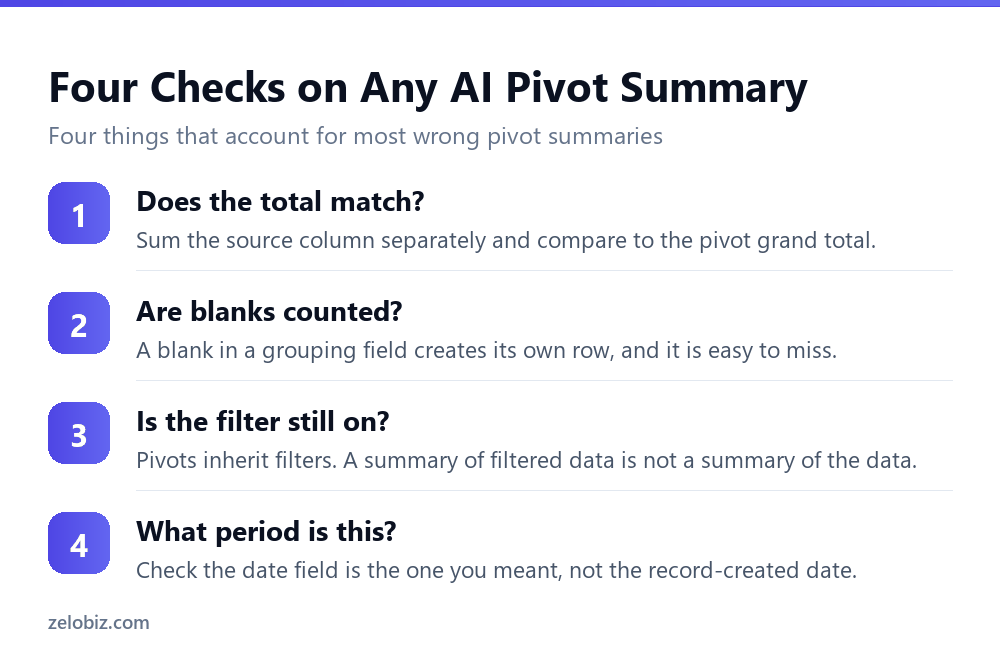
These take about a minute between them and catch most of the ways a pivot summary goes wrong.
Does the grand total match the source?
Sum the source column somewhere separate and compare it to the pivot’s grand total. If they differ, something is filtered, excluded or double-counted, and every conclusion above it is unreliable.
Is there a blank row?
Blanks in a grouping field create their own row in a pivot, usually at the bottom where nobody scrolls. That row is often where the interesting problem is hiding, and a summary that ignores it is incomplete.
Is a filter still applied?
Pivot tables remember filters. A summary described as covering all sales may be covering one region because someone filtered it last week and saved the file.
Which date field is it using?
Most exports carry more than one date. Order date, invoice date, record created, last modified. Grouping by the wrong one shifts everything by days or weeks without producing anything that looks like an error.
The Same Data, Two Different Answers
A concrete version of the column-name problem, because it is easier to recognise than to describe.
Imagine a sales export with columns for Date, Customer, Region, Amount and Status. Ask for a summary of revenue by region and you will get one, immediately, with a total and a sentence about which region performed best.
Now consider what is actually in those columns in a typical export.
Every number in the resulting summary is arithmetically correct. It is also answering a different question: total order value including refunds and cancellations, grouped by rep territory, over a period defined by when records were edited.
Nothing about that output looks wrong. There is no error, no warning, and the totals reconcile against the column they were drawn from. This is precisely why it is worth spending a minute on definitions before asking anything.
⚠️ Watch out: The Status column is the one that catches people most often. A pivot including Cancelled and Pending rows produces a revenue figure that is simply too high, and it will look plausible right up until someone reconciles it against the accounts.
When to Skip the AI and Just Build It
There is a category where reaching for AI genuinely costs more time than it saves, and it is larger than people expect.
When you already know the answer’s shape
If you know you want sales by month with a total, building the pivot takes under a minute. Describing what you want, reading the reply and then building it anyway takes longer, and you end up less familiar with what the pivot contains.
When the data is small
Under a few hundred rows you can see what is in the data by looking at it. Sorting and filtering answers most questions faster than describing them, and you will notice the oddities that a summary would smooth over.
When the answer will be reported
If a number leaves your desk and lands in front of someone else, you want to have built it yourself and know exactly what it includes. Being asked what a figure covers and having to say the AI produced it is not a position worth being in.
- Use AI when you are exploring unfamiliar data, inherited a workbook, or cannot remember how to do something specific in a pivot.
- Build it yourself when you know what you want, the data is small, or the result will be reported to someone else.
- Never paste a summary containing judgement words into a report without rewriting them yourself.
📊 Note: This is the same pattern that runs through most AI-in-spreadsheets questions. It is strongest where you lack familiarity and weakest where you already have it, which is the opposite of how most tools work.
A Better Way to Ask
If you want a summary you can actually use, give it the context it cannot infer.
- Define the ambiguous columns. Amount is net of refunds. Date is when the order was placed. Region is the customer’s country, not the rep’s.
- State the period explicitly. This covers January to June 2026 only.
- Say what you already know. March was low because of a system migration, so ignore it when describing the trend.
- Ask for observations, not conclusions. Tell me what changed between quarters is answerable. Tell me how we are doing is not.
📊 Note: That last distinction is the most useful one on this page. Asking what changed produces something checkable. Asking how we are doing produces something that sounds like insight and is really just the same numbers with confident adjectives.
Common Questions
Can AI build a pivot table for me?
It can tell you which fields belong in rows, columns, values and filters, which is the part people find fiddly. Building it is still a few clicks you do yourself, and that is a good thing because you see what it contains.
Why does AI get pivot table summaries wrong?
Because it infers what your data means from column headings. A column called Amount is assumed to be revenue received, when in most real exports it includes refunds as negatives. The arithmetic is right and the description is wrong.
What should I check on an AI pivot summary?
Whether the grand total matches the source column summed separately, whether there is a blank row in a grouping field, whether a filter is still applied from a previous session, and which of your date fields it grouped by.
Is AI good at explaining an existing pivot table?
Yes, and it is the safest use. Asking what a pivot counts, what is filtered and where its source range points is read-only and much faster than tracing it manually.
Should I paste an AI summary of my data into a report?
Not without editing. Watch for judgement words like strong, concerning or underperforming, because those describe context the AI does not have, such as your targets or why a particular month was unusual.
Why is my pivot total higher than the accounts figure?
Most often because cancelled or pending rows are included. A Status column filters those out in a properly built pivot, but a summary asked for without mentioning Status will happily count them, producing a revenue figure that looks plausible until someone reconciles it.
Does it matter which AI tool I use for pivot tables?
Less than the context you give it. A tool that can see the workbook saves you describing the columns, but it still cannot know that Region means the rep’s territory rather than the customer’s location. That has to come from you either way.
How do I get a more accurate summary?
Define the ambiguous columns in one sentence each, state the period explicitly, mention anything unusual you already know about, and ask what changed rather than how things are going.
The Short Version
- →AI reads column names as definitions. Your column names are labels, and they mislead it.
- →Mechanical questions are safe: which fields go where, why a pivot looks wrong, how to add a percentage.
- →Interpretive questions are not. It has no idea what your targets were.
- →Check the grand total against the source before trusting anything above it.
- →Watch for blank rows, leftover filters, and the wrong date field.
- →Ask what changed, not how we are doing.