

The first decision when you automate Google Sheets report building is which parts should never involve AI. That sounds backwards for an article about using it, and it is the reason most automated reports either work for years or quietly produce nonsense.
Every number should be deterministic. The one place AI genuinely belongs is the paragraph at the top that nobody enjoys writing.
Short answer: Build the report manually first, keep the data, calculations and output on separate sheets, and automate the assembly with a menu-driven script before you add a time trigger. Let AI write the summary paragraph and flag unusual rows, never the figures. Add a failure alert the same day you add the trigger, because a scheduled report that breaks fails silently. Verified 30 August 2026.
What Should and Should Not Be AI
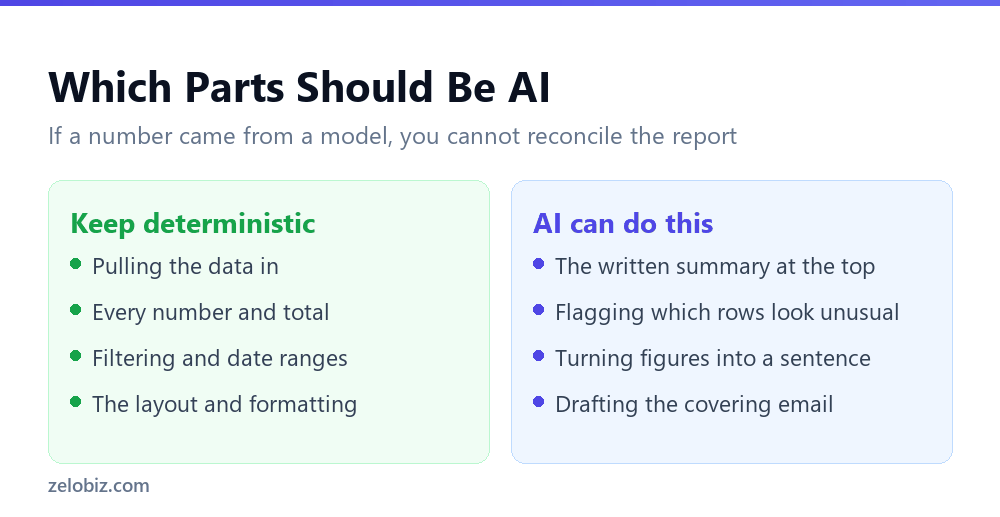
The dividing line is reconciliation. If someone questions a figure in the report, you need to be able to trace it back to source. A number produced by a model cannot be traced, only regenerated, and it may regenerate differently.
So every total, count, average and percentage comes from a formula. Those are auditable, they produce the same answer every time, and anyone can click the cell and see where it came from.
Where AI earns its place
The commentary. Most recurring reports have a paragraph at the top saying what changed and why it matters, and writing that every month is the part people resent.
Give AI the finished figures and ask it to describe the movement. It is working from numbers your formulas produced, so the facts are correct and only the phrasing is generated.
It is also good at flagging rows that look unusual against the rest of the data, which is a genuinely hard thing to express as a rule. Have it flag, not decide.
Build It Manually First
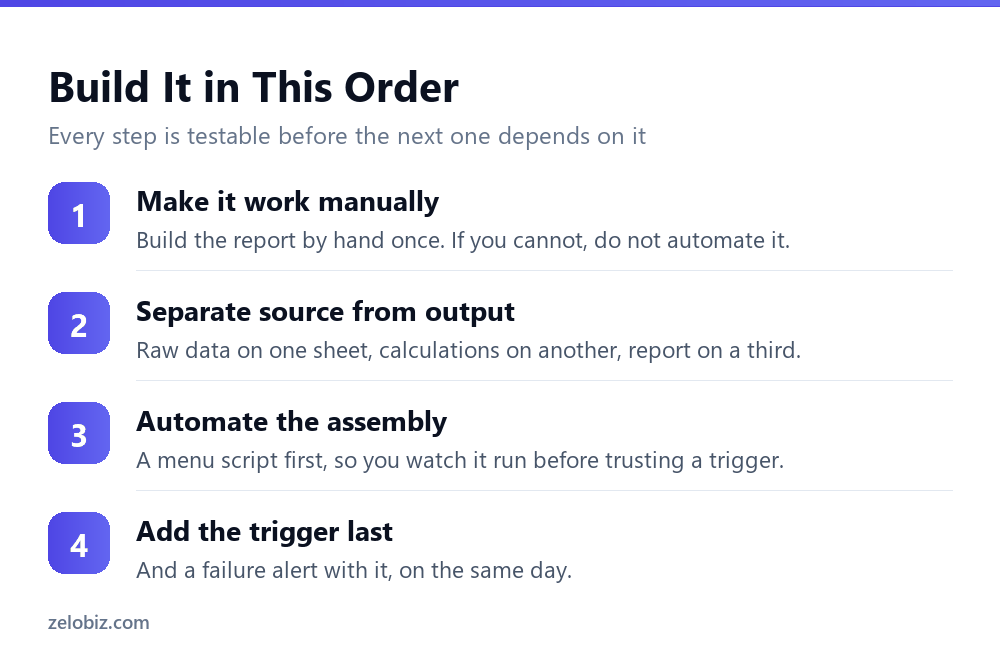
This is the step people skip and the one that decides whether the project finishes.
Step one: produce the report by hand, once
If you cannot build it manually, you cannot automate it, because you do not yet know what it should contain. Doing it once by hand surfaces every awkward decision while they are still cheap to change.
This is the same principle as choosing what to automate at all, which our guide to what to automate first covers: automate settled processes, not ones you are still working out.
Step two: separate the three layers
Raw data on one sheet, untouched by anything except the import. Calculations on a second. The presentable report on a third.
This matters more than it seems. When something breaks in six months, you need to know immediately whether the data arrived wrong or the calculation changed. Mixed together, you cannot tell.
Step three: automate assembly with a menu script
Write a script you trigger by clicking a menu item, and run it manually for a few cycles. You watch it work, you see the output, and any problem happens while you are looking at it.
A menu-driven script also gets six minutes to run rather than the thirty seconds a custom function gets, which matters as soon as the data grows. Our guide to reviewing AI-written Apps Script covers that distinction and what to check in the code.
Step four: add the trigger, and the alert, together
Only once it has run cleanly by hand several times. And add the failure notification on the same day, not as a later improvement, because later never arrives.
A Structure That Survives
The three-sheet split is worth spelling out, because how you arrange it decides how painful the first breakage is.
The Log sheet is the one people leave out and later wish they had. One row appended per run, recording when it ran, how many source rows it saw and whether it completed, turns an unanswerable question into a glance.
When someone asks why last month’s figure changed, the log tells you whether the report ran twice, ran against a smaller import, or did not run at all. Without it you are guessing.
Why the direction matters
Each sheet reads only from the one before it and never writes backwards. That single constraint means a problem can always be located: if Report is wrong but Calc is right, the fault is in presentation. If Calc is wrong but Data is right, the fault is in a formula. If Data is wrong, the import failed.
Mixed together, all three failures look identical, which is why inherited report workbooks are so unpleasant to debug.
Before You Automate Anything
Three questions worth answering honestly, because a report that nobody reads is a maintenance burden dressed as productivity.
- Who actually reads this? A surprising number of recurring reports are produced monthly and opened by nobody. Automating one of those makes it permanent.
- What decision does it inform? If the answer is none, the useful automation is deleting the report rather than scheduling it.
- What happens if it is a day late? If the answer is nothing, you do not need an hourly trigger, and a daily one costs a fraction of the runtime budget.
📊 Note: Ask the recipients before building. The most common outcome of that conversation is discovering that two of the six sections are the only ones anyone looks at, which makes the whole thing considerably easier to automate and to maintain.
The Quotas That Shape the Schedule
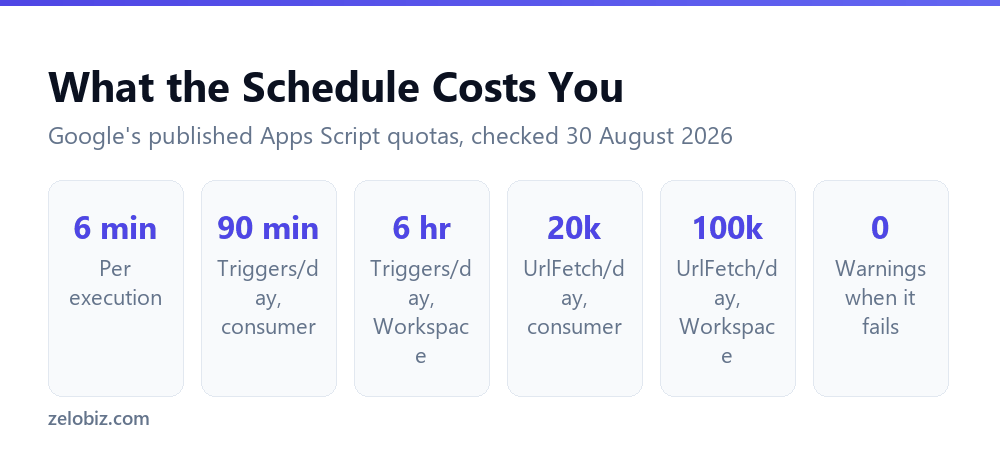
Google publishes limits that decide how often you can realistically run this, and they differ substantially by account type.
The six-minute execution ceiling is the first wall. A report pulling from an API and processing thousands of rows will hit it, and when it does the script stops partway with the work half finished.
The daily trigger budget is the second. Ninety minutes a day on a personal Gmail account sounds generous until you run something hourly that takes four minutes, which is nearly the whole allowance. Workspace accounts get six hours, which is a meaningful difference if you are building anything frequent.
💡 Pro tip: Prefer daily or weekly over hourly unless the report genuinely needs to be current. Most recurring reports are read once a week regardless of how often they refresh, and a less frequent schedule uses less of the budget and gives you a wider window to notice failures.
The Failure Mode Nobody Plans For
A scheduled report that breaks does not announce itself. It simply stops updating, or worse, keeps producing output from stale data.
The second case is the dangerous one. If the import fails but the calculation sheet still holds last month’s data, the report generates successfully with figures that are a month old, and it looks completely normal.
Three guards worth adding
- Stamp the run time on the report itself. A visible generated-on line means anyone reading it can see immediately if it is stale. This is the cheapest guard and the most effective.
- Check the data looks alive. If the source has fewer rows than last time, or the latest date is older than expected, stop and alert rather than proceeding.
- Email a real person on failure. Not a log. A message to someone who will notice, naming which step failed.
⚠️ Watch out: The row-count check is worth the extra ten lines. An import that silently returns nothing produces a report full of zeros, and zeros look like a bad month rather than a broken pipeline. People have made decisions on that mistake.
Writing the Commentary Well
Once the numbers are solid, the AI part is straightforward, and a few things make the output usable rather than generic.
Give it the figures and the comparison period explicitly. Tell it what the business considers normal. Ask for observations rather than conclusions, because it has no idea what your targets were.
That last point matters as much here as anywhere. Our guide to AI pivot table summaries covers why words like strong or concerning are judgements about context the model does not have, and why they are the sentences most likely to be quoted back at you.
📊 Note: Keep the commentary clearly separated from the figures, visually and structurally. Anyone reading should be able to tell at a glance which part was calculated and which part was written. That distinction protects you when someone disagrees with the interpretation.
Common Questions
Should AI generate the numbers in an automated report?
No. Every total, count and percentage should come from a formula, because those are auditable and produce the same answer every time. A figure produced by a model cannot be traced back to source, only regenerated, and it may regenerate differently.
What should AI do in a recurring report?
The written commentary, flagging rows that look unusual, and drafting the covering email. It works from figures your formulas already produced, so the facts stay correct and only the phrasing is generated.
How do I schedule a Google Sheets report to run automatically?
Write a menu-driven Apps Script first and run it by hand for several cycles so you can watch it work. Once it runs cleanly, add a time-driven trigger, and add a failure notification on the same day rather than later.
Why does my scheduled Apps Script stop partway through?
The six-minute execution limit, which applies to both consumer and Workspace accounts. Process in chunks and record progress so the next run continues where the last stopped.
How often can I run a scheduled script?
It depends on your account. Consumer accounts have 90 minutes of total trigger runtime per day and Workspace accounts have 6 hours. An hourly job taking four minutes uses nearly the whole consumer allowance.
How do I know if my automated report has broken?
Only if you built that in. Stamp the generation time visibly on the report, check the source data has a plausible row count and a recent date before proceeding, and email a named person when a step fails.
Should the report email itself to people automatically?
Only once it has run reliably for a month or two. An automated report that emails a distribution list is also an automated way to send everyone stale or broken figures. Send it to yourself first, and add the recipients when you have stopped finding problems.
What is the worst failure mode for an automated report?
An import that fails while the calculation sheet still holds old data. The report generates successfully with stale figures and looks entirely normal, which is far more dangerous than a report that visibly does not run.
The Short Version
- →Every number deterministic. AI writes the commentary, never the figures.
- →Build it by hand once. If you cannot, you do not know what it should contain yet.
- →Keep raw data, calculations and report on separate sheets.
- →Menu script first, watched for several cycles. Trigger last, with the alert.
- →Six minutes per execution. 90 minutes of triggers a day on a consumer account.
- →Stamp the run time on the report. Stale output is worse than no output.
Apps Script quotas checked against Google’s own documentation on 30 August 2026.