

To make a budget in Excel, build three simple sections: an Income list, an Expenses list with Planned and Actual columns side by side, and a Summary that subtracts total expenses from total income. Two formulas cover almost all of it — =SUM() for each section’s total, and one subtraction for the bottom-line number. No macros, no add-ins, and no need for a downloaded template to get something that actually works.
The structure that actually works
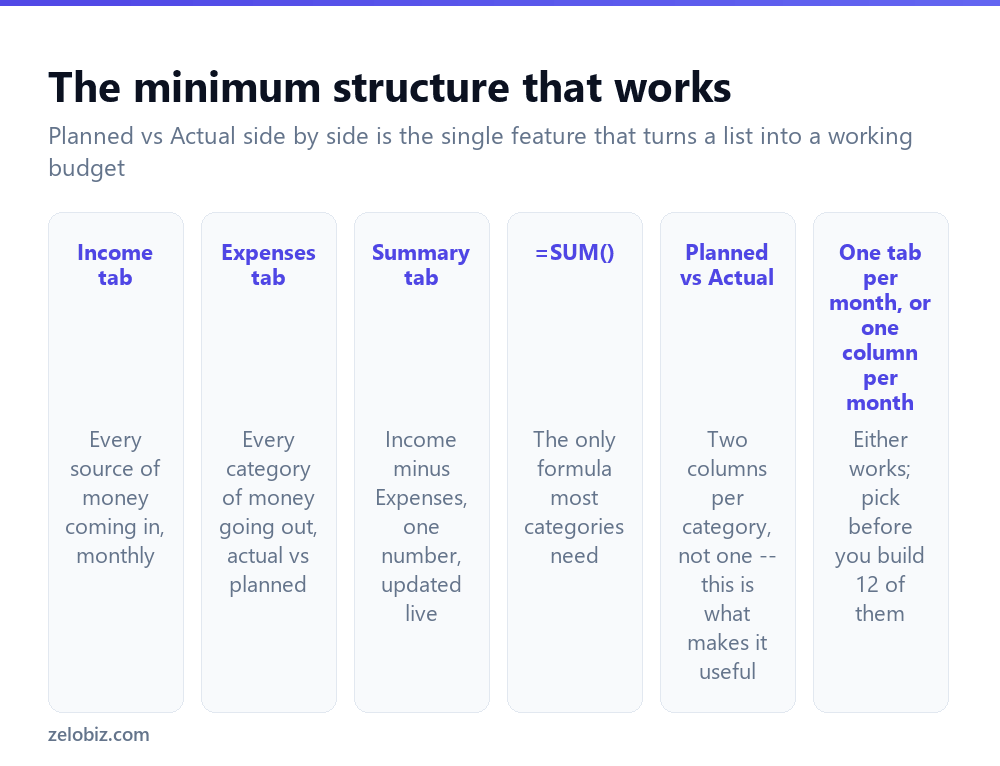
Budget templates online are often over-built — colour-coded dashboards, gauge charts, a dozen tabs. None of that is what makes a budget useful. What makes it useful is one thing: seeing Planned versus Actual for every category, side by side, updated as the month goes.
Income — every source of money coming in, with a monthly amount. Most people have one or two rows here.
Expenses — every category of spending, with two columns: what you planned to spend, and what you actually spent. This is the part a plain spending list misses, and it’s the difference between tracking and budgeting.
Summary — one small section showing Total Income, Total Planned Expenses, Total Actual Expenses, and the difference. This is the tab you actually look at day to day.
A list of expenses with no Planned column is spending tracking, not budgeting. The Planned column is what lets you catch a category running over before the month ends, not after.
Building it step by step
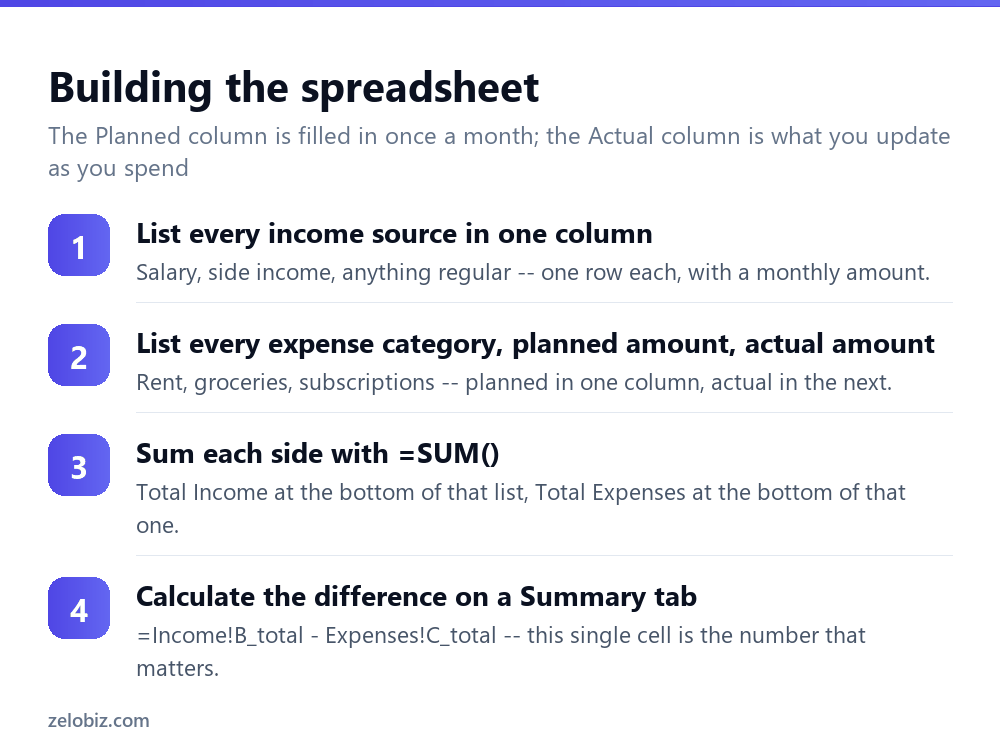
List every income source down a column, one row each, with the monthly amount next to it. Sum it with =SUM(B2:B10) — adjust the range to however many rows your sources take, leaving a few spare rows for anything added later.
List expense categories the same way, but with two amount columns instead of one: Planned and Actual. Fill in Planned once at the start of the month based on what you expect to spend. Update Actual as the month progresses, either by hand from receipts or pulled from a bank statement export.
On a Summary tab, reference the totals from both other tabs: =Income!B12-Expenses!D12 where B12 is Total Income and D12 is Total Actual Expenses. This single cell is your real bottom line — positive means you’re under budget, negative means you’re over.
Categories worth having their own row
The categories that matter most are the ones easy to lose track of because they don’t happen every week: Housing (rent or mortgage), Utilities, Groceries, Transport, Subscriptions (worth its own line — these accumulate silently), Debt payments, Savings (treat this as an expense line, not what’s left over), and one Miscellaneous catch-all for anything that doesn’t fit elsewhere.
Treating Savings as an expense rather than whatever’s left at the end of the month is the single change that makes the most practical difference — it gets budgeted and protected the same way rent does, instead of competing with discretionary spending for what’s left.
Percentage of budget used
A useful addition once the basic structure works: a percentage column showing how much of each category’s Planned amount has actually been spent so far. =D2/C2, formatted as a percentage, where C is Planned and D is Actual.
Format that column with conditional formatting — green under 80%, yellow 80-100%, red over 100% — so an overspending category is visible at a glance without reading every number. This is the same feature covered in more depth in the conditional formatting guide linked below.
Tracking multiple months
Two approaches both work, and the right one depends on how much you want to compare month to month.
One tab per month, duplicated from a template tab (right-click the tab, Move or Copy, tick Create a Copy) keeps each month self-contained and simple, but comparing March against April means opening both tabs side by side.
One column per month on a single Expenses tab — category rows down the side, month columns across the top — makes trends visible instantly (a SUM row and a simple line chart show the whole year at a glance) but the sheet gets wide and each month’s entry requires care to update the right column.
For most personal budgets, one tab per month duplicated from a template is simpler to maintain and less error-prone. Reach for the single wide sheet only if trend comparison across many months matters more than simplicity.
A simple 50/30/20 check
One quick sanity check once the categories are filled in: group them into Needs, Wants, and Savings, and compare each group’s share of total income against the 50/30/20 guideline — roughly 50% needs, 30% wants, 20% savings and debt payoff. It’s a rule of thumb, not a hard target, but it’s a fast way to spot a budget that’s structurally off before diving into individual categories.
Add one small formula for it: =SUMIF(CategoryType,"Needs",Actual)/TotalIncome, repeated for Wants and Savings, each formatted as a percentage. If Needs is running at 70%, that’s a more useful signal than any single category being slightly over, because it points at a structural gap between income and fixed costs rather than a spending habit.
Building in a buffer category
A budget that allocates every single dollar of income to a named category tends to break the first month something unexpected comes up — a car repair, a higher-than-usual utility bill, a gift. Rather than letting that overflow eat into an unrelated category and making the whole sheet look broken, add a deliberate Buffer or Miscellaneous line with a genuine planned amount, even a modest one.
This does two things: it absorbs small surprises without distorting the categories that are meant to track something specific, and if it goes unused in a given month, that unspent amount becomes a visible, honest surplus rather than vanishing into rounding.
Common errors
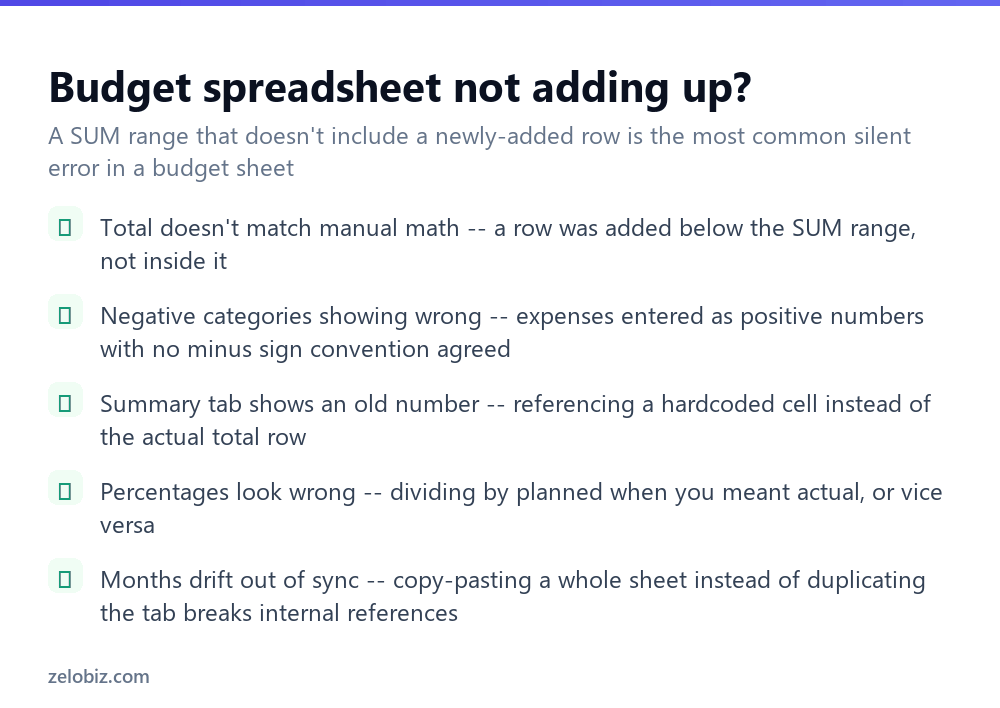
Total doesn’t match manual math — a category was added as a new row below the existing SUM range rather than inserted inside it. Inserting a row in the middle of an existing range extends the SUM automatically; adding one below the last row doesn’t.
Summary tab shows a stale number — it’s referencing one specific cell that used to be the total, rather than the actual total row, and a row was inserted since, shifting everything down by one. Point the Summary formula at the SUM cell directly, and double-check it after any structural change to either tab.
Months drift out of sync — copying an entire sheet with Ctrl+C/Ctrl+V instead of using Move or Copy (with Create a Copy ticked) can leave formulas referencing the original tab instead of the new one. The Move or Copy dialog handles internal references correctly; a manual copy-paste of the whole sheet sometimes doesn’t.
Irregular income and expenses
Not everyone has a fixed monthly paycheque. For variable or freelance income, base the Planned column on a conservative average of the last three to six months rather than a single good or bad month, and treat anything earned above that as a bonus to allocate separately — extra debt payoff or savings — rather than baking it into next month’s regular budget, where a slow month later would leave the plan short.
- ✓Give expenses two columns: Planned and Actual, not just one
- ✓Treat Savings as its own expense line, not what’s left over
- ✓Point Summary formulas at the total row, not a specific number that might shift
- ✓Use Move or Copy (not Ctrl+C) to duplicate a month’s tab
- ✓Add a percentage-used column with conditional formatting to spot overspending fast
- ✕Building a spending tracker with no Planned column and calling it a budget
- ✕Adding a new expense row below the existing SUM range instead of inside it
- ✕Letting Savings be whatever’s left instead of budgeting it directly
- ✕Copy-pasting a whole sheet and ending up with cross-referenced formulas
- ✕Building twelve tabs before confirming the first month’s structure actually works for you
Frequently asked questions
How do I make a simple budget in Excel?
Build three sections: an Income list, an Expenses list with Planned and Actual columns, and a Summary that subtracts total expenses from total income.
What formulas does a budget spreadsheet need?
Mostly just =SUM() for totalling each section, plus one subtraction formula on the Summary tab for the bottom-line number.
Should I track budget by month in separate tabs or one sheet?
Separate tabs per month are simpler to maintain for most people. A single sheet with one column per month is better if comparing trends across many months matters more.
Why doesn’t my budget total match when I add a new expense?
The new row was likely added below the existing SUM range rather than inserted inside it, so the total formula doesn’t include it.
Should savings be part of the budget or what’s left over?
Budget savings as its own expense line with a planned amount, the same as rent or utilities, rather than treating it as whatever remains at month’s end.
How do I highlight when I’m overspending in a category?
Add a percentage-used column (Actual divided by Planned) and apply conditional formatting — green, yellow, red — so overspending is visible without reading every number.
- →Highlight overspending automatically: how to use conditional formatting in Excel
- →Total spending by category: how to use SUMIF in Excel
- →Summarise a year of spending: how to make a pivot table in Excel
- →Count transactions in each category: how to count cells in Excel